
Welcome to the IRAPS public-facing interactive dashboards.
If you have questions/feedback or would be interested in receiving email updates, please visit the help page.
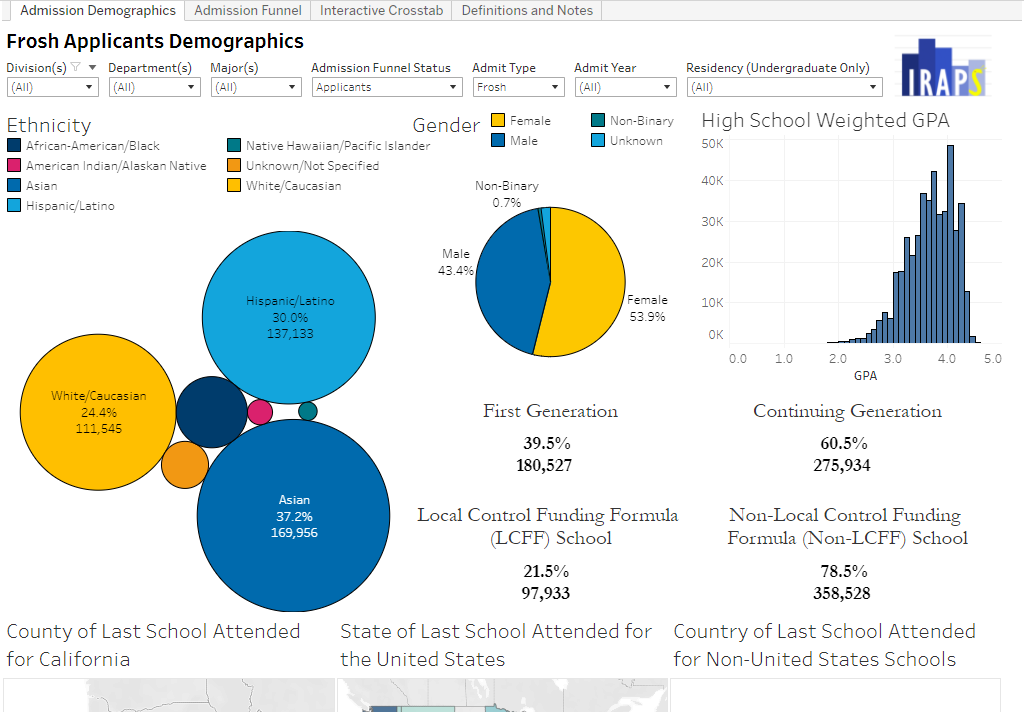
Undergraduate admissions from applications through enrollments by division, department, major, admit type, demographics, and residency.
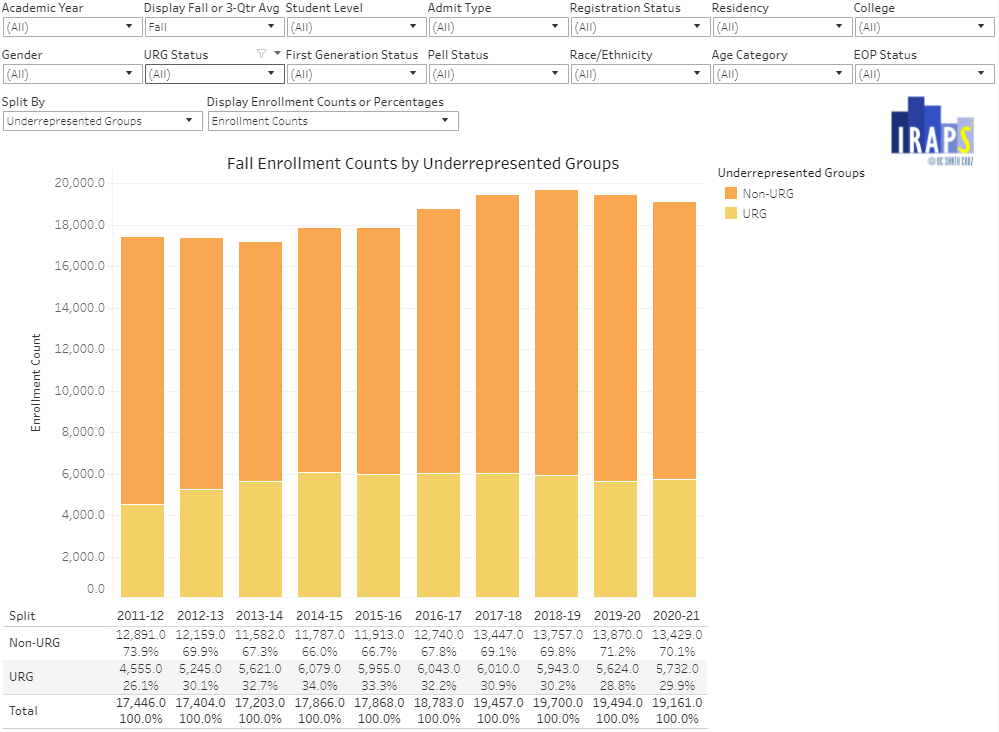
Enrollment by Student Characteristics
Fall and 3-quarter average campus enrollment counts. Can be filtered or split by admit type, class level, registration status, residency, college, gender, race/ethnicity, age, first generation, Pell, and underrepresented R/E statuses. Also includes home location, institution of origin, and high school and transfer GPA information for new frosh and transfers.
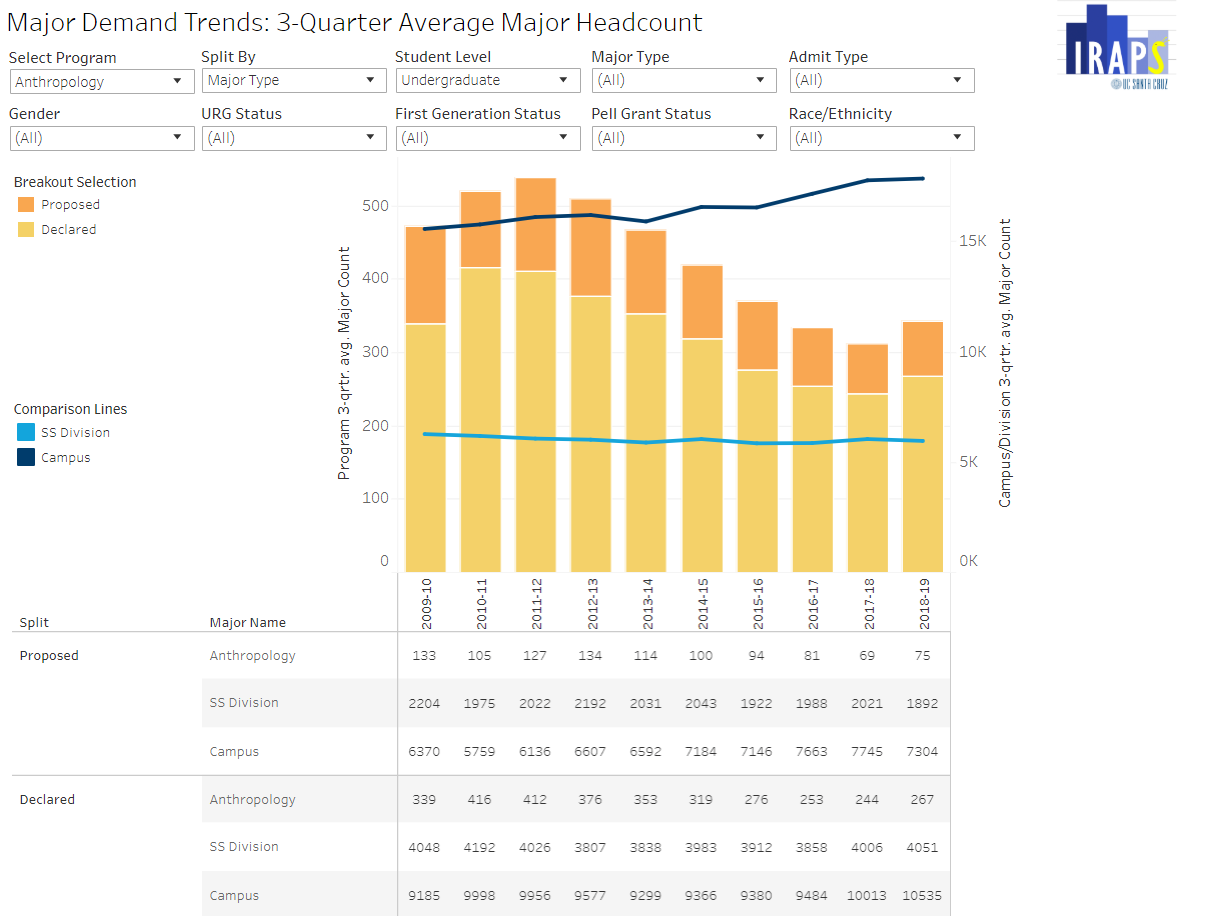
Program-level fall and 3-quarter average major trends with divisional and campus total comparisons. Can be filtered or split by admit type, student level, major type, gender, first generation, Pell, and underrepresented R/E statuses.
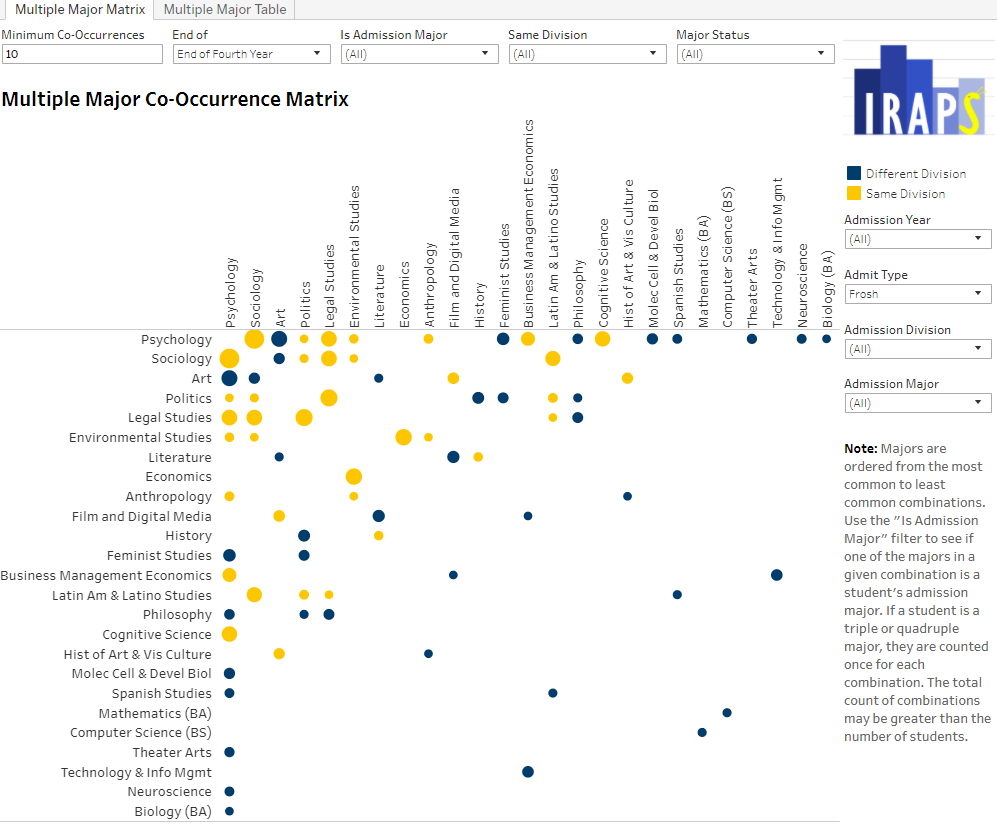
Major combinations for undergraduates who declare or graduate in two or more majors by entering cohort.
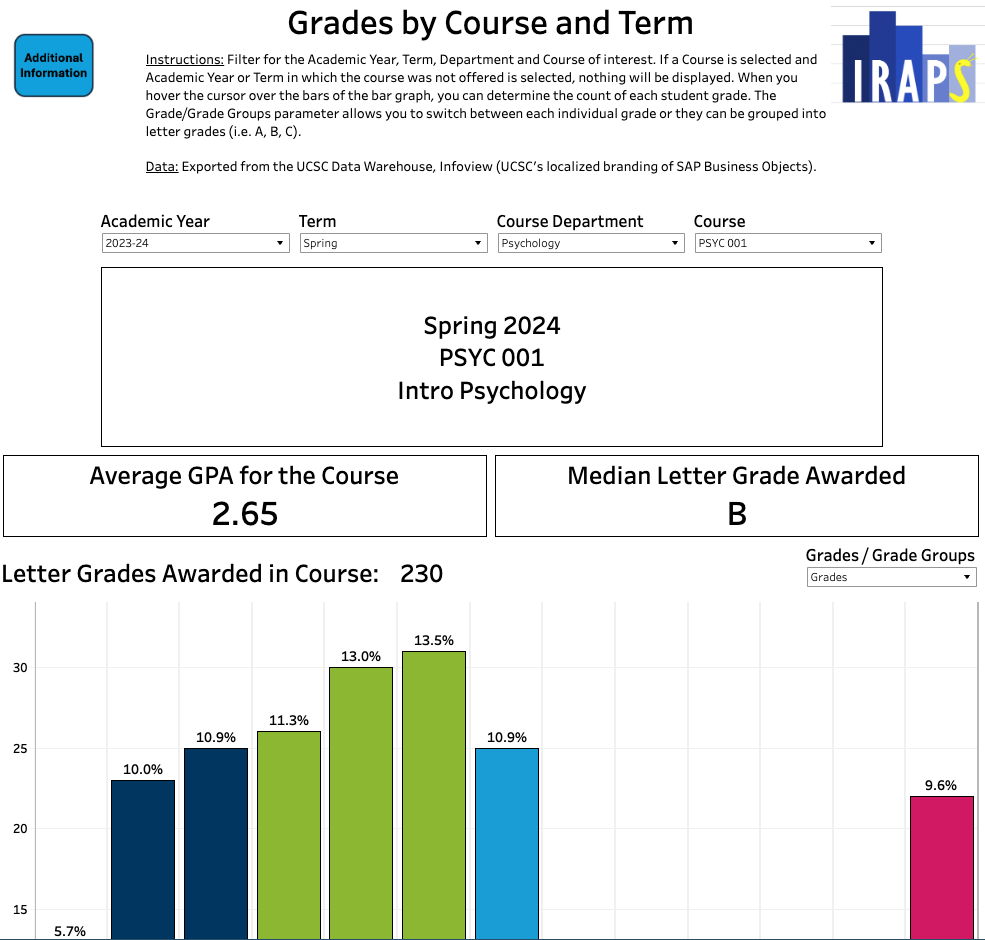
Provides grades for courses taught at UCSC beginning in 2010-11.
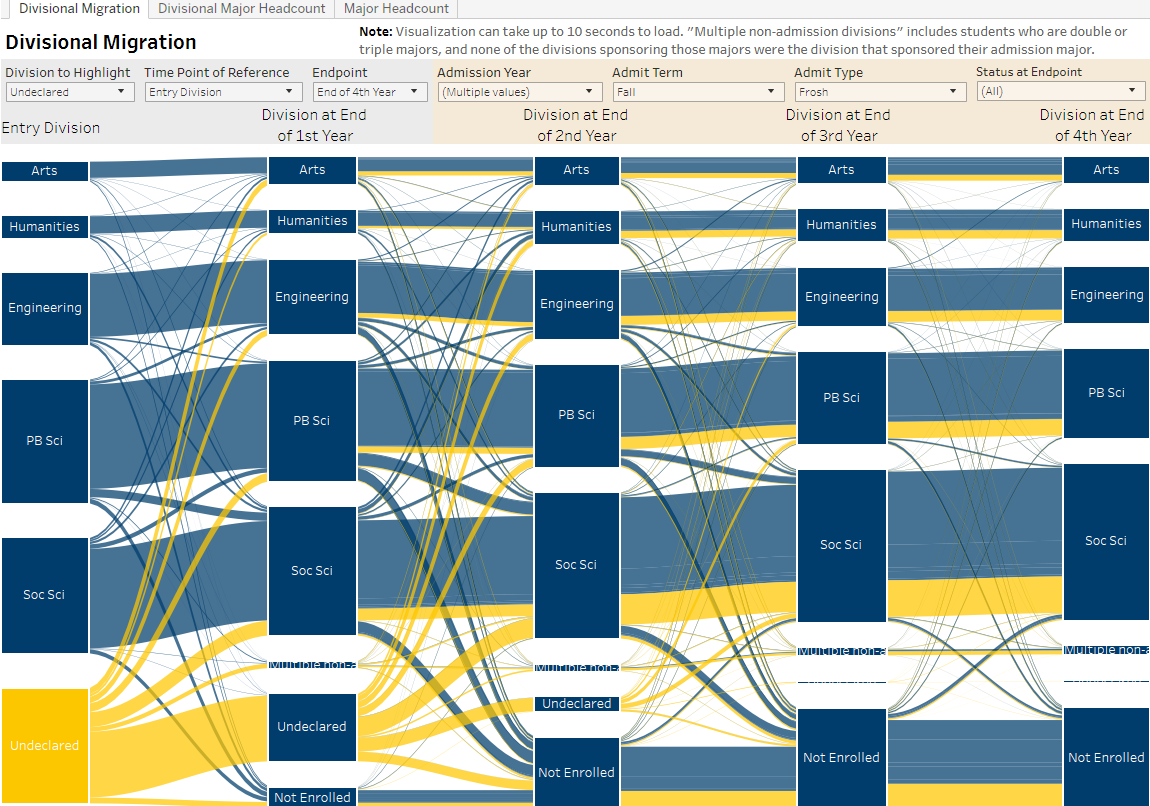
Division major migration and major headcounts by elapsed years since entry for entering frosh and transfer cohorts.
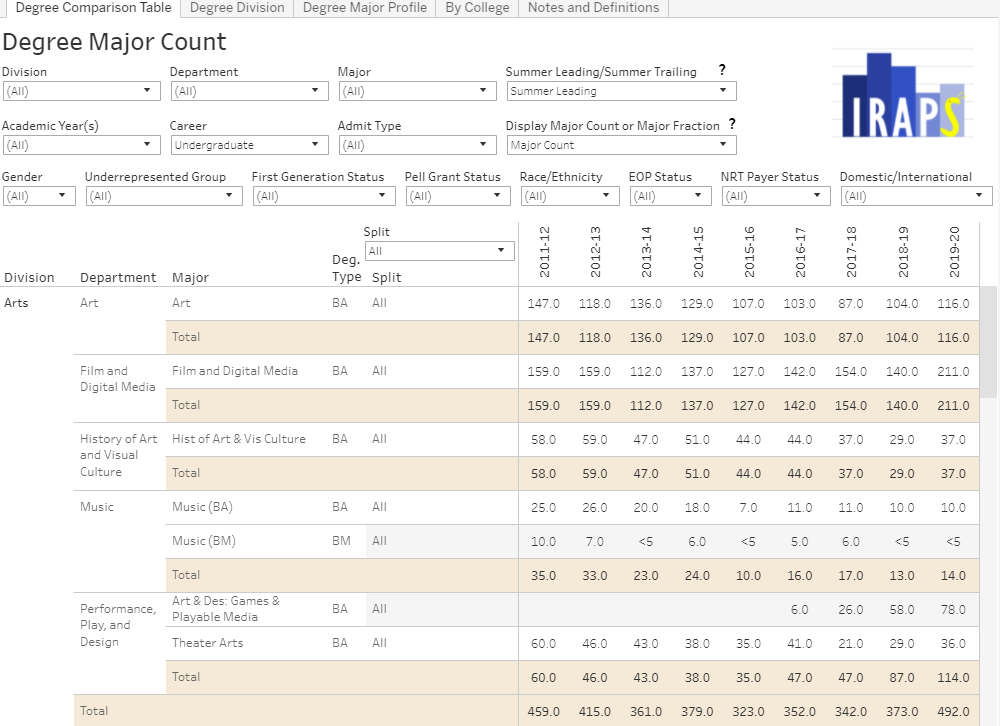
Degrees awarded by division, major, and college. Includes major count and major fraction. Can be split and filtered by gender, race/ethnicity, underrepresented R/E, Pell, first generation, EOP, non-resident tuition, and domestic/international.
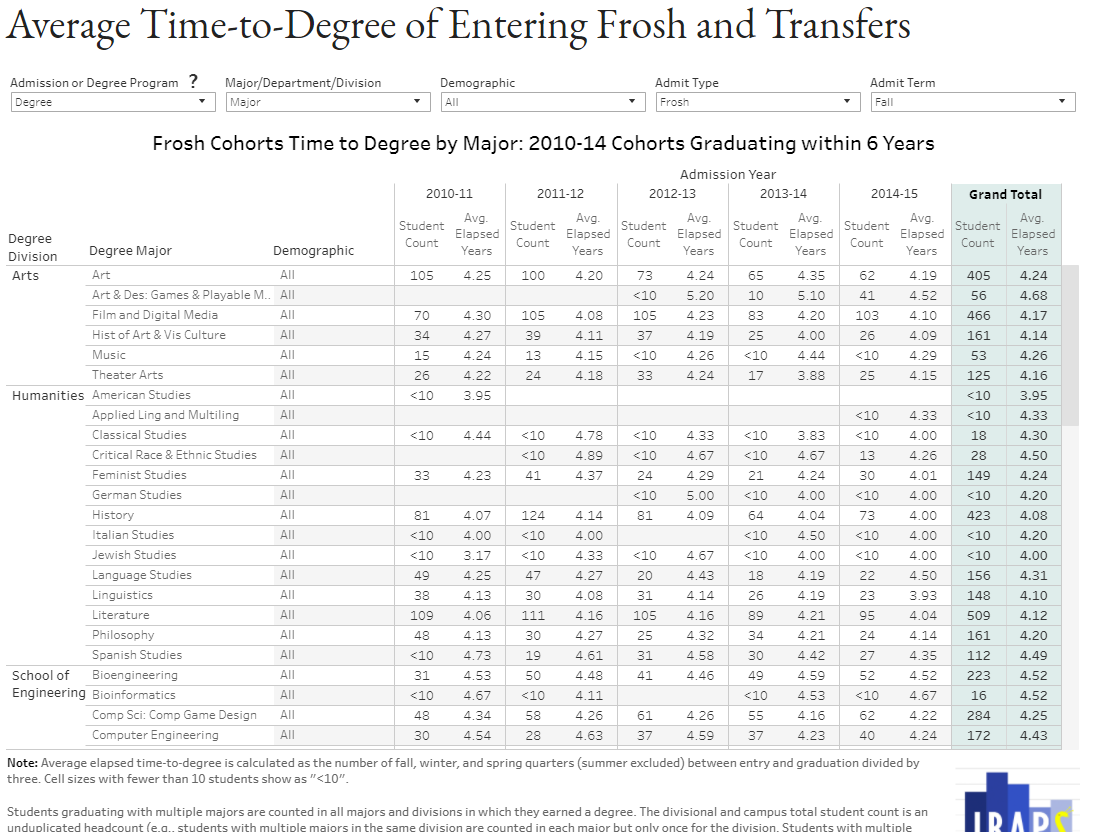
Average-time-to-degree for frosh and transfer cohorts by division and degree major or by admission major.
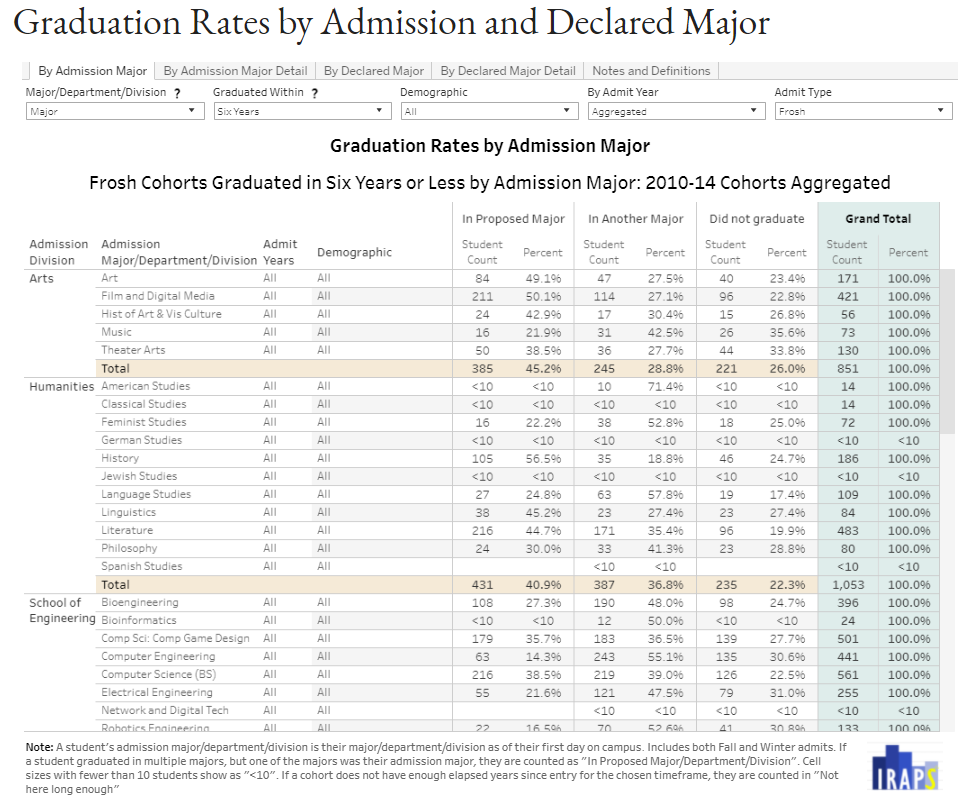 Graduation Rates by Admission and Declared Major
Graduation rates of entering frosh and transfer cohorts by their intended major at admission or their declared major.
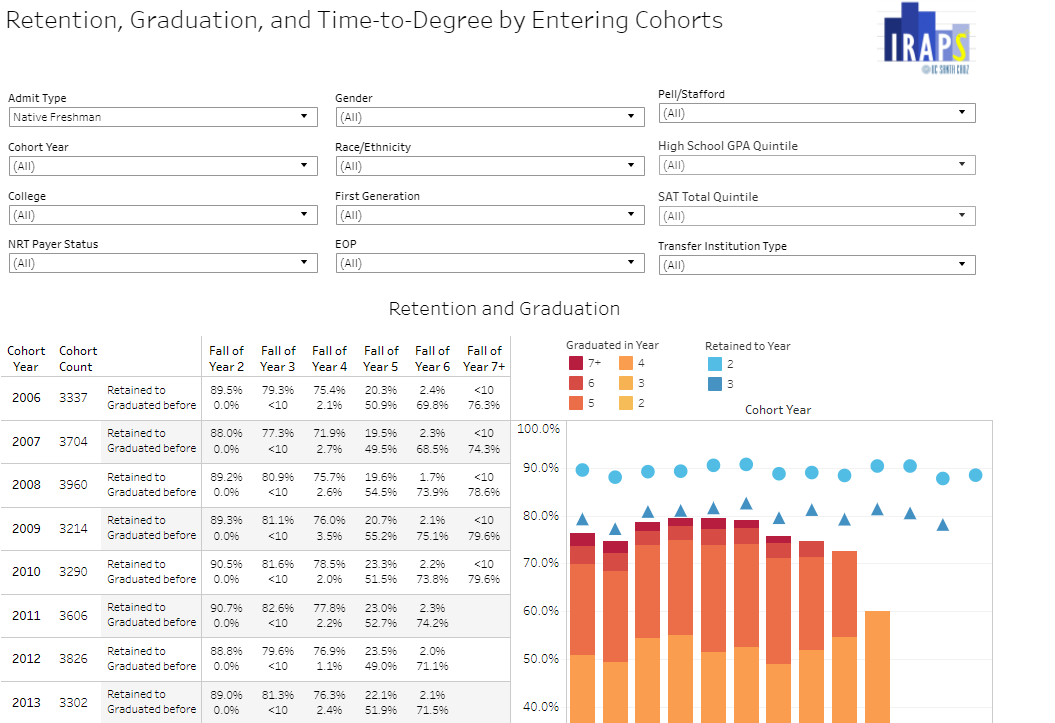
Retention, Graduation, and Time-to-Degree by Entering Cohorts
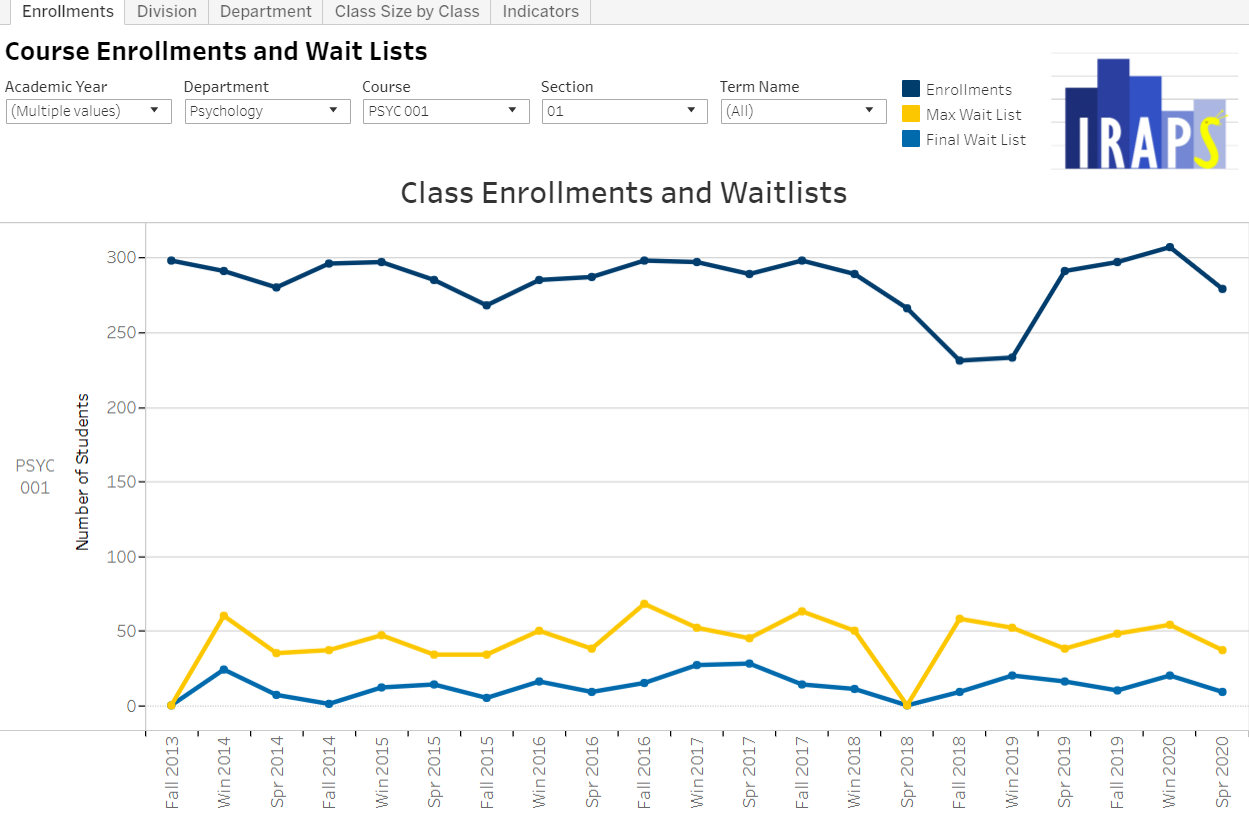
Course Enrollments and Class Sizes
Course enrollments, waitlist information, class size distributions, and average class size trends by division, department, course level, and course type.
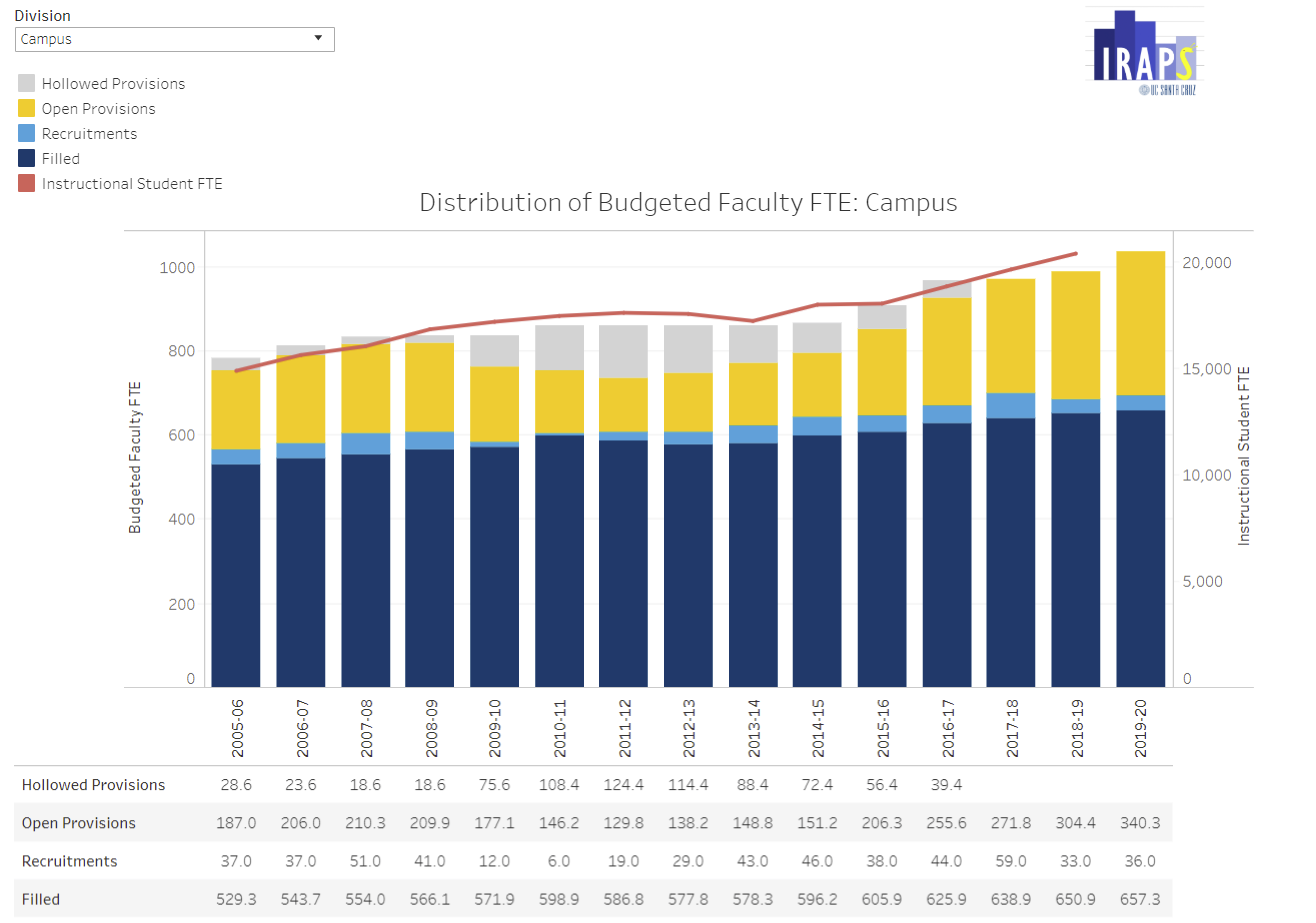
Distribution of Budgeted Faculty FTE
Total budgeted faculty FTE by division and for the entire campus, broken into filled positions, active recruitments, and open provisions.
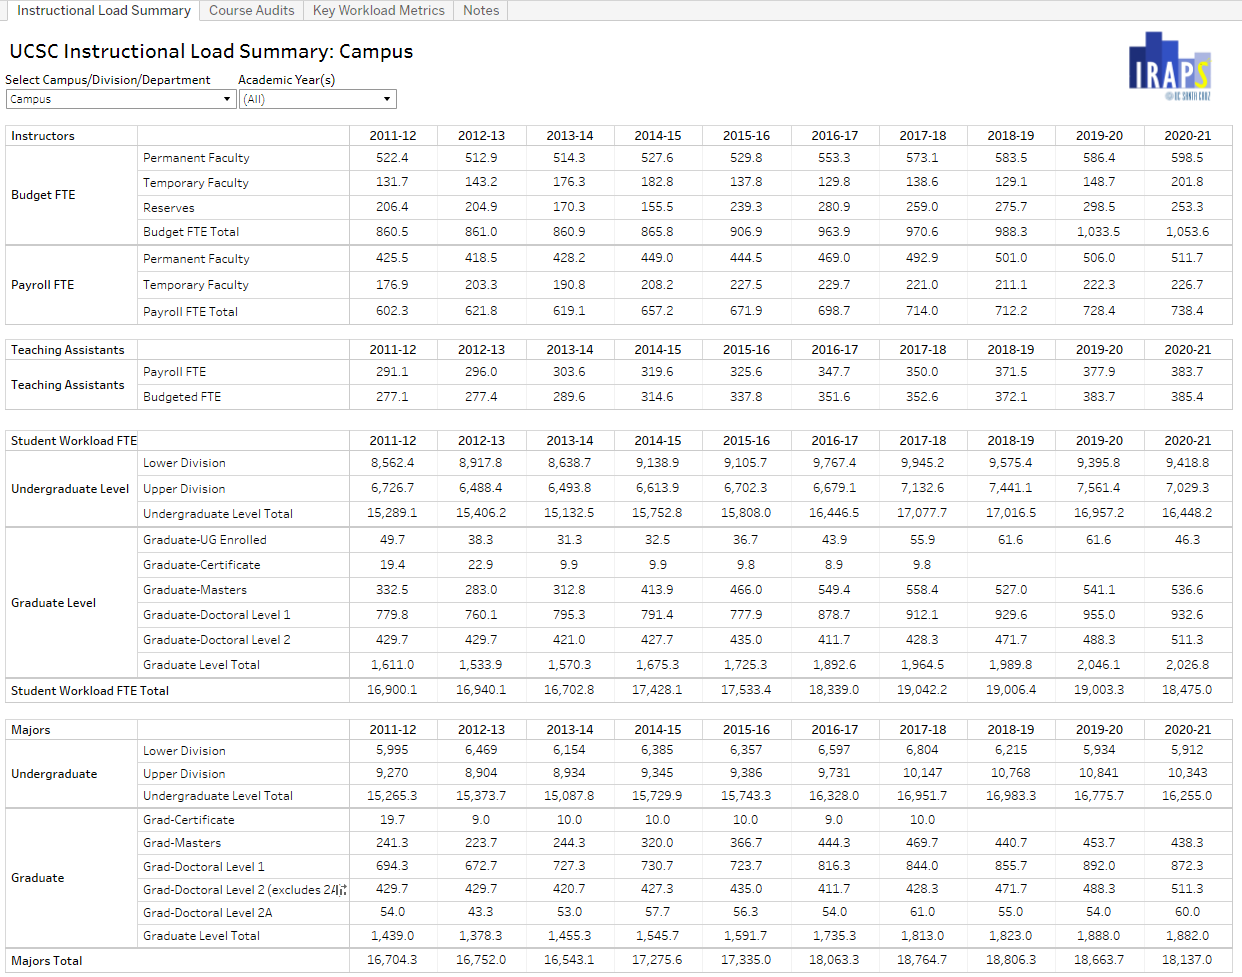 Instructional Load Summary and Course Audits
Provides key instructional workload metrics (enrollments, courses, student FTE, majors, degrees) per teaching resources (budgeted and payroll faculty FTE, and teaching assistants) at the campus, division, and department level that were historically reported in the Instructional Load Summary (ILS) and Course Audits reports.
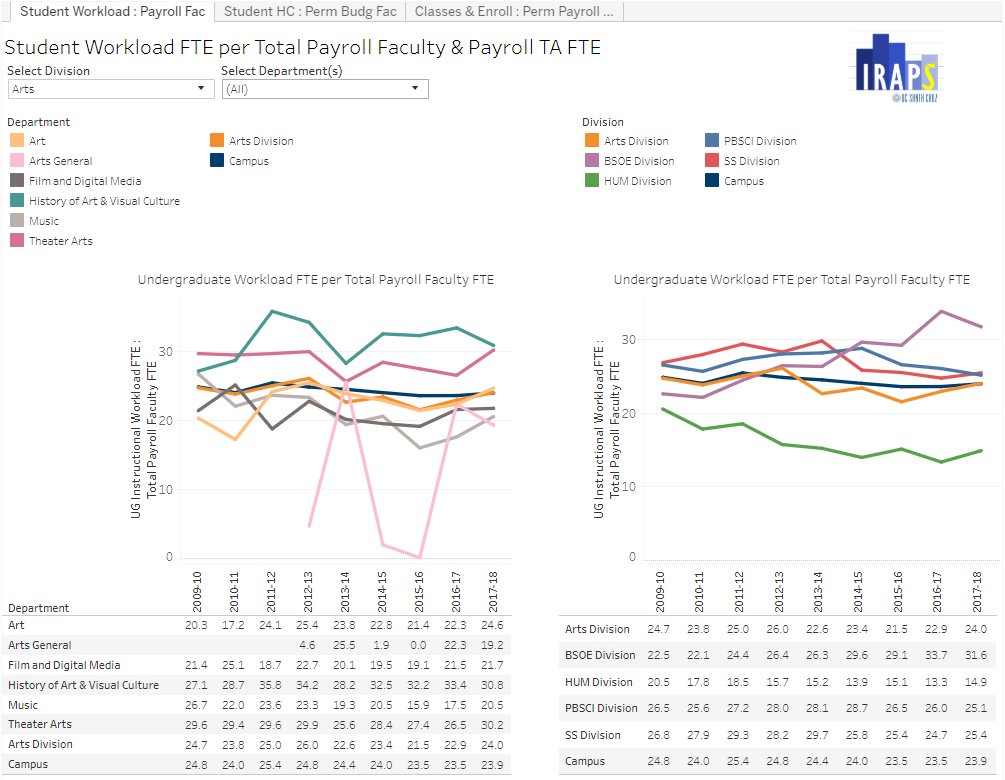
Faculty Workload FTE and Course Load
Measures of faculty workload are indicated for each department, including Student Workload FTE per Total Payroll Faculty FTE; Major Headcount per Permanent Budgeted Faculty FTE; and regular class counts and enrollments per Permanent Payroll Faculty FTE by department, along with divisional and campus totals.
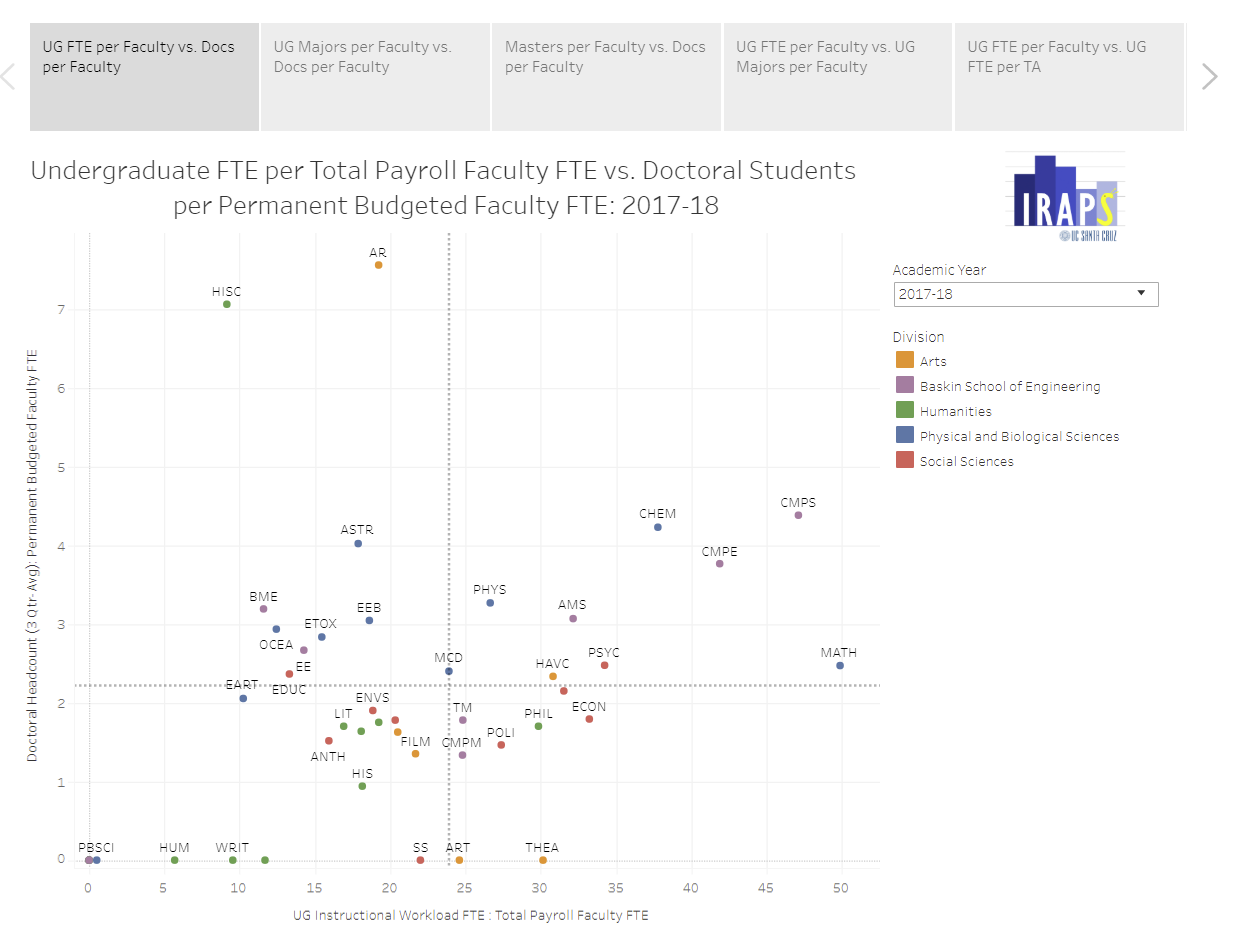
Comparative Instructional Ratios
Comparative instructional ratios by department.
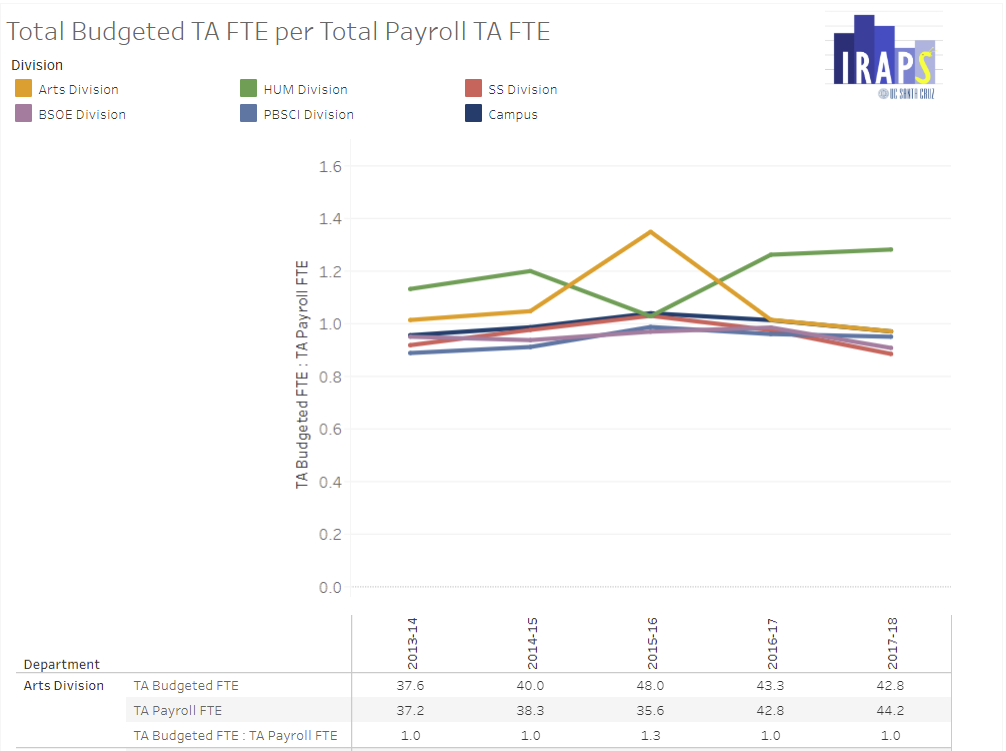
Budgeted and Payroll TA FTE counts, and Budgeted to Payroll TA FTE ratios by division over time.
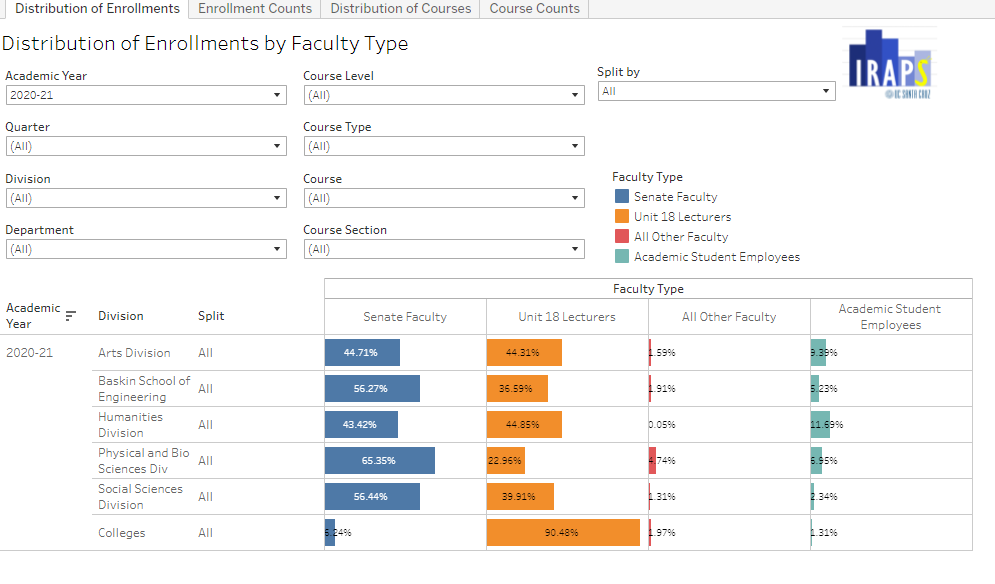
Distribution and counts of enrollments and courses by instructor type (senate faculty, unit 18 lecturers, other faculty, and academic student employees). Data can be drilled down to an individual course section.
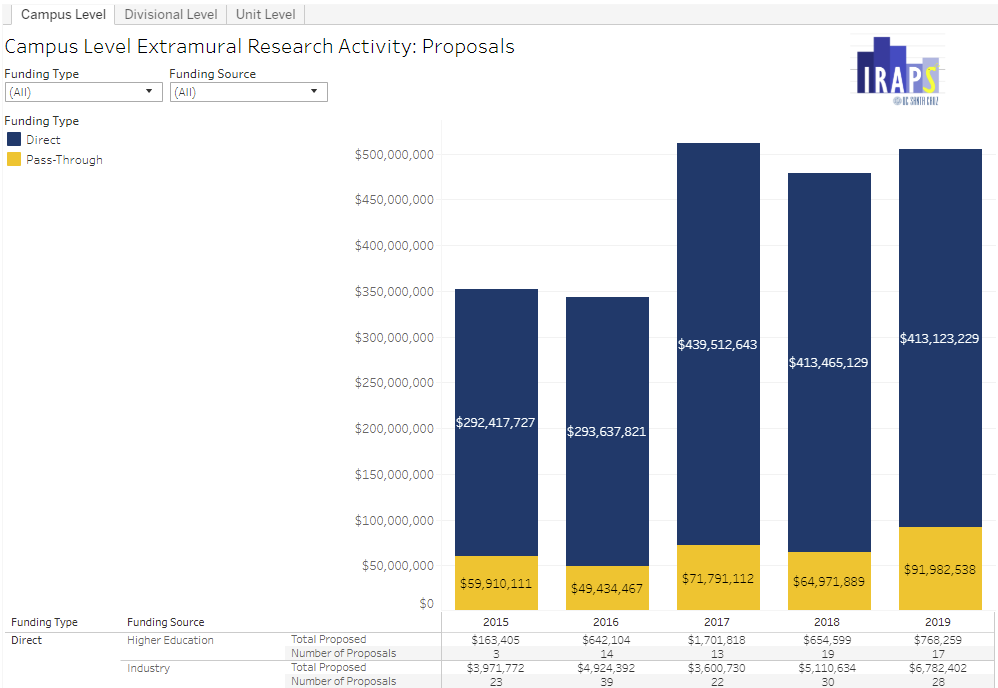
Extramural Research Activity: Proposals
Extramural research proposals by campus, division, and proposal unit.
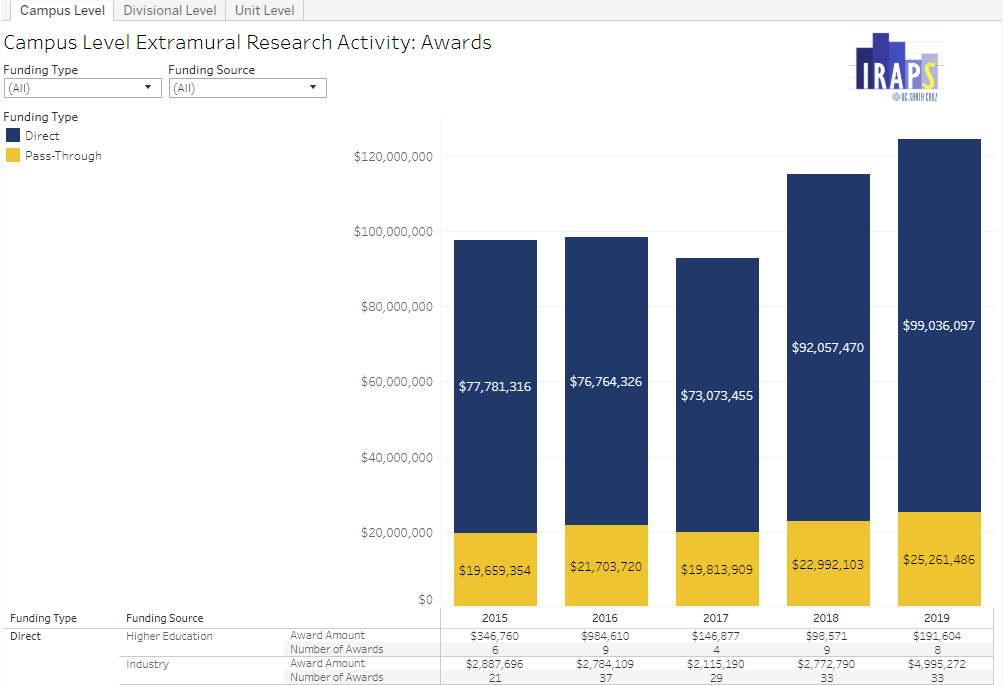
Extramural Research Activity: Awards
Extramural research awards by campus, division, and award unit.
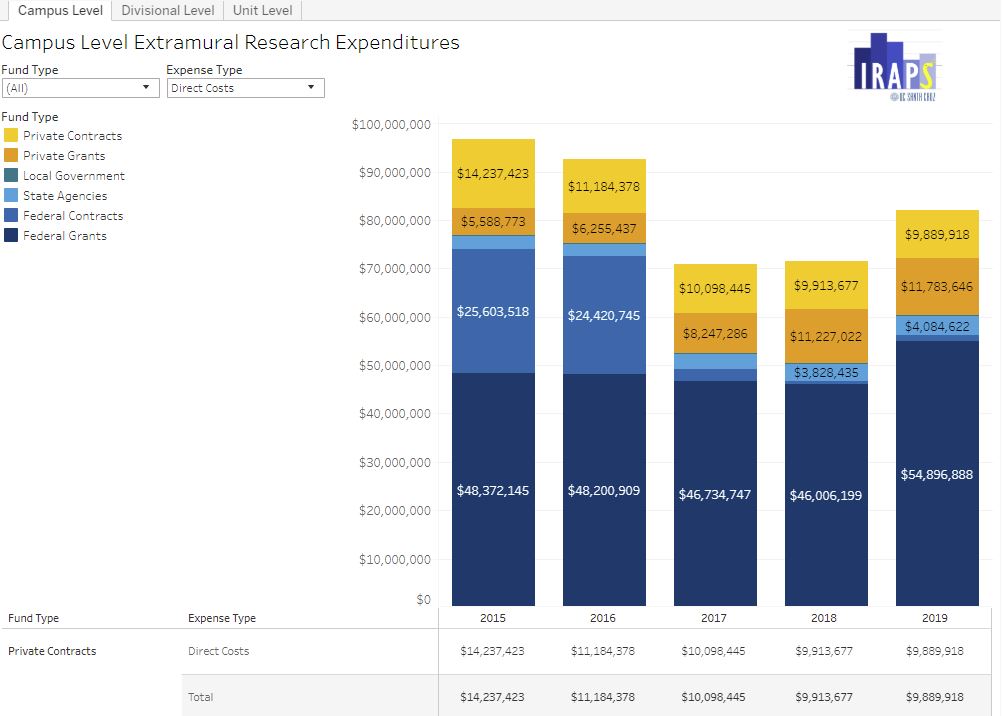
Extramural Research Expenditures
Extramural research expenditures by campus, division, and administrative unit.
