
Welcome to the IRAPS internal dashboards. These dashboards and tools contain restricted, non-public data and require sign-in.
If you have questions/feedback or would be interested in receiving email updates, please visit the help page.
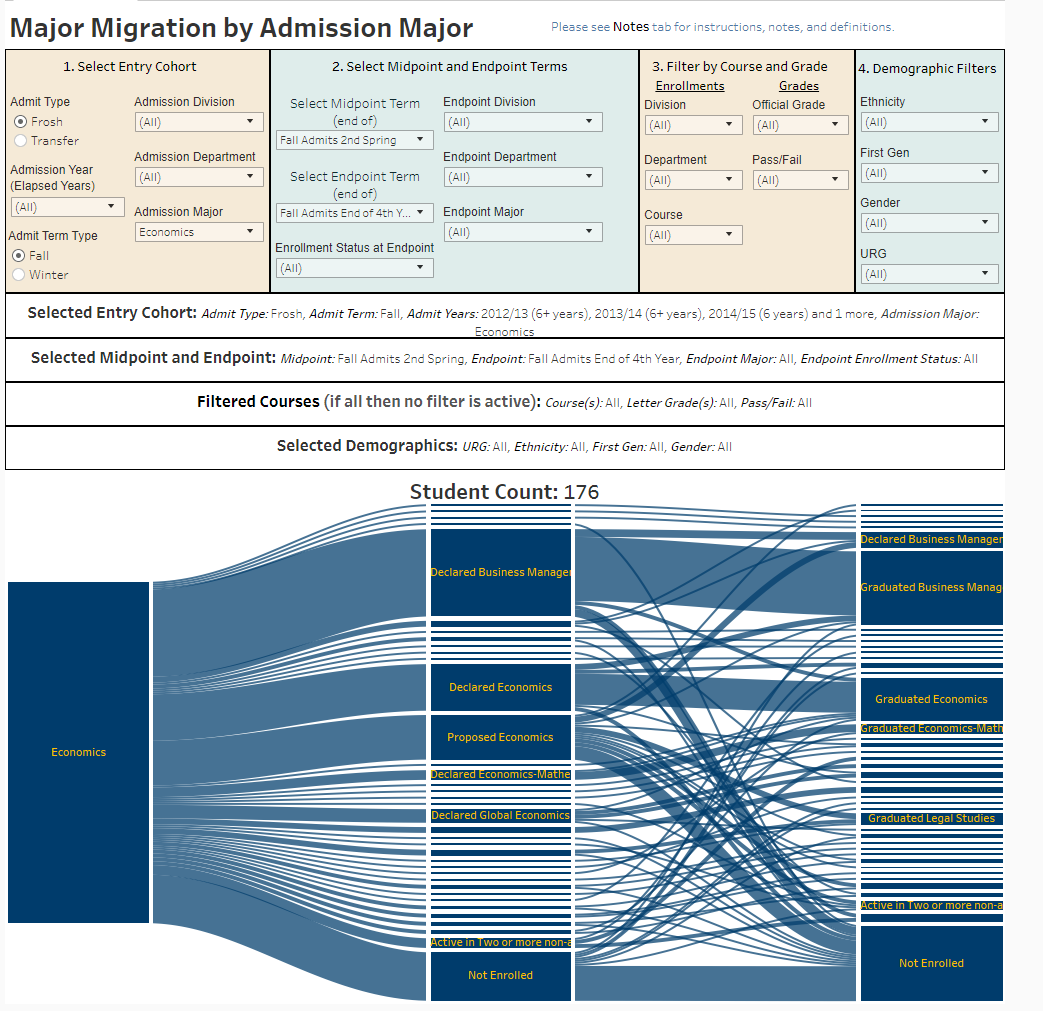
Major Migration by Admission Major
Provides major migration and graduation data, course-taking patterns, and course outcomes for selected entering cohorts by intended major at admission.

This dashboard provides College Choice Survey results from undergraduate students admitted to UC Santa Cruz for Fall 2023.

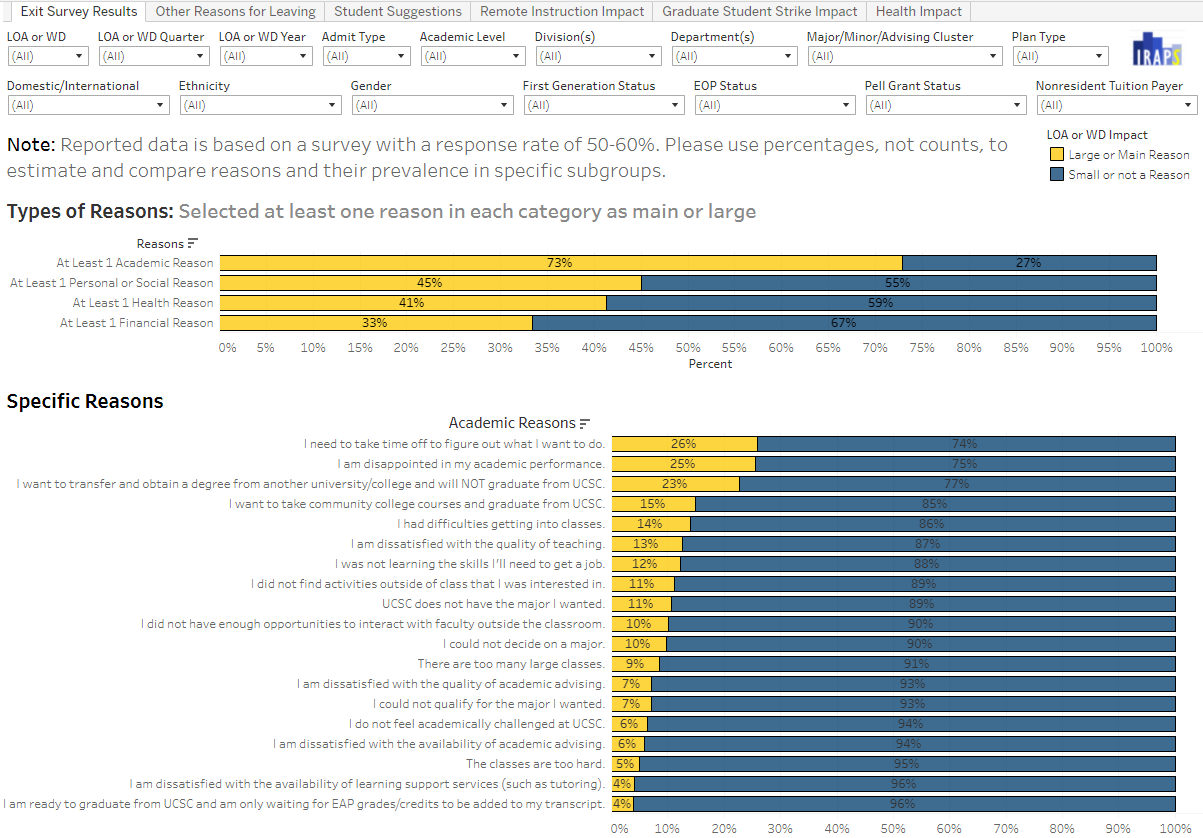
Exit Survey results of undergraduates filing a Leave of Absence or Withdrawal petition using the current version of the survey revised in December 2023.
Pre-2024 Exit Survey results of undergraduates filing a Leave of Absence or Withdrawal petition using the previous version of the survey.

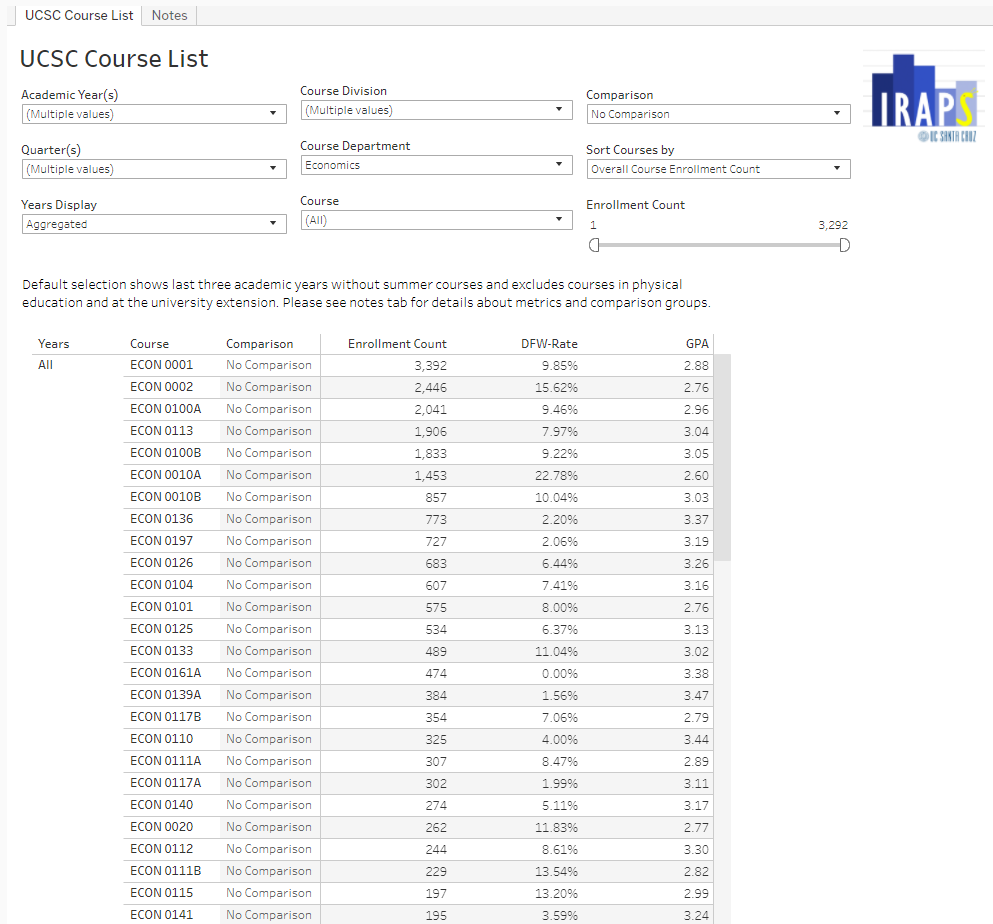
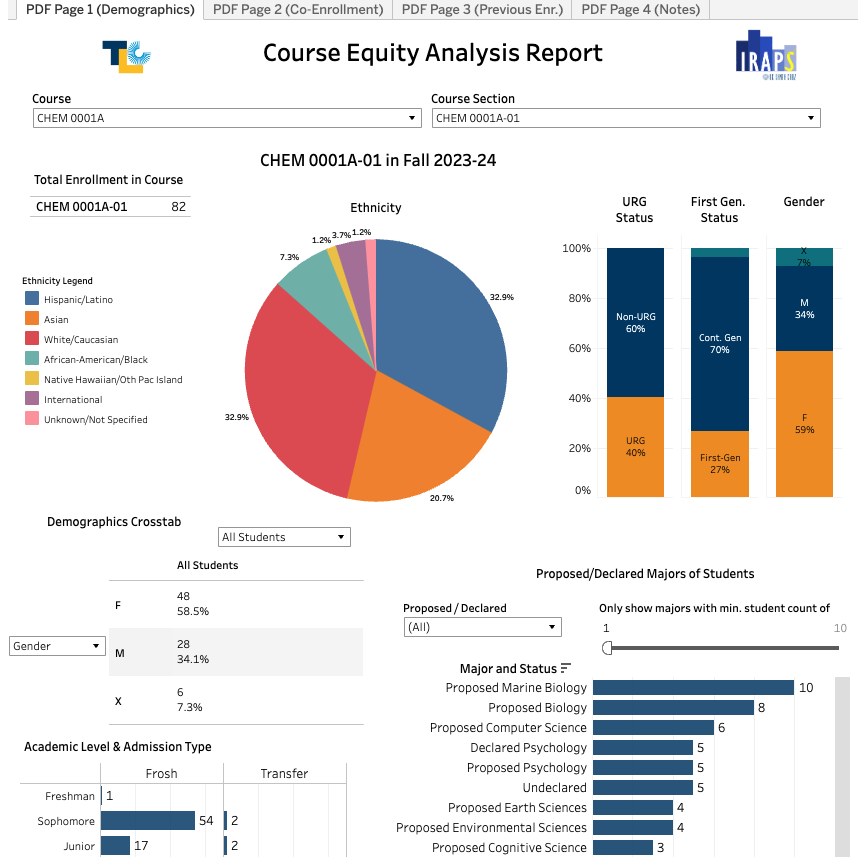
Provides information about the composition and grades of courses taught at UCSC from 2010-11 through 2023-24.
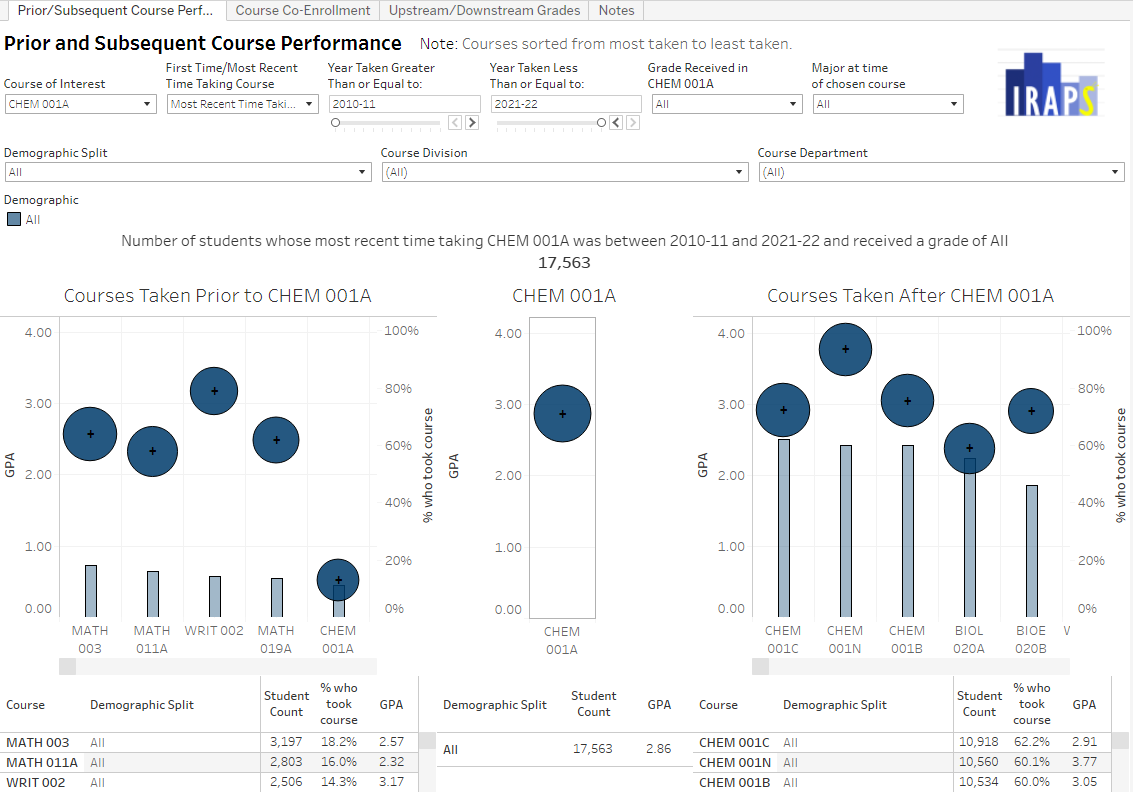 Upstream/Downstream Course Performance
Provides data on grades in courses taken prior to, subsequently, and concurrently with selected target courses, as well as the relationship between grades in selected pairs of courses.
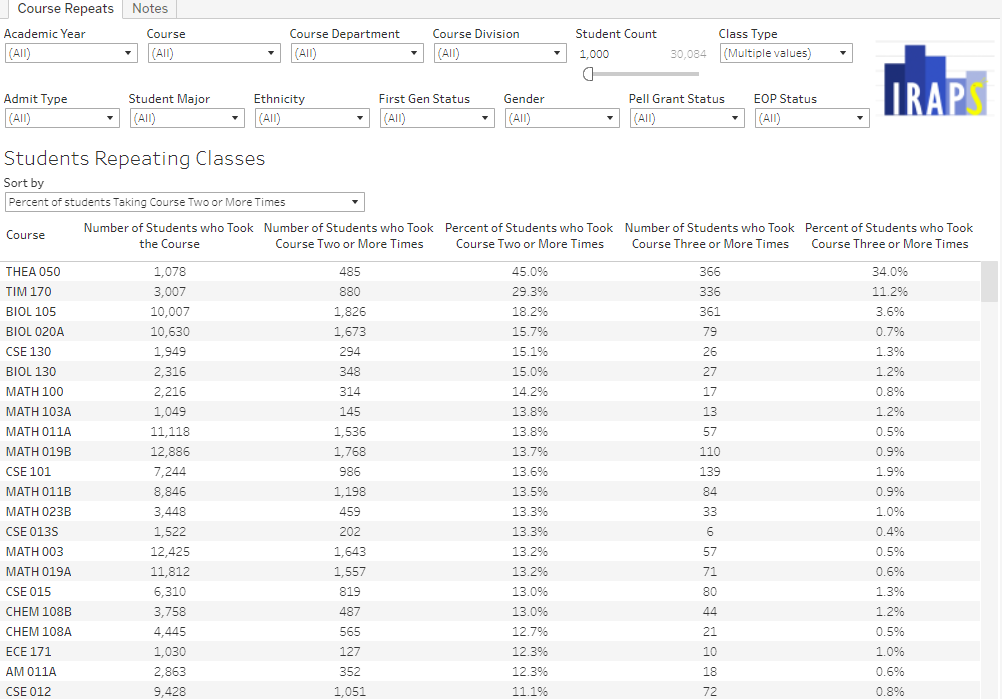
Provides counts and percentages of repeat enrollments by course with filtering options for student demographics.
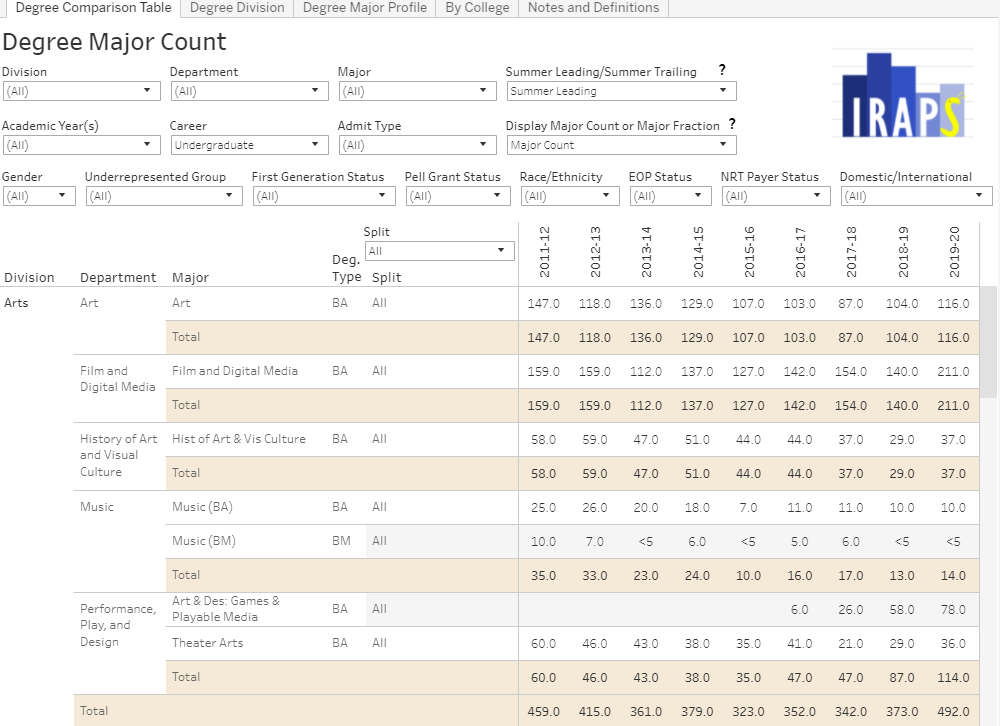
Degrees awarded by division, major, and college. Includes major count and major fraction. Can be split and filtered by gender, race/ethnicity, underrepresented R/E, Pell, first generation, EOP, non-resident tuition, and domestic/international.
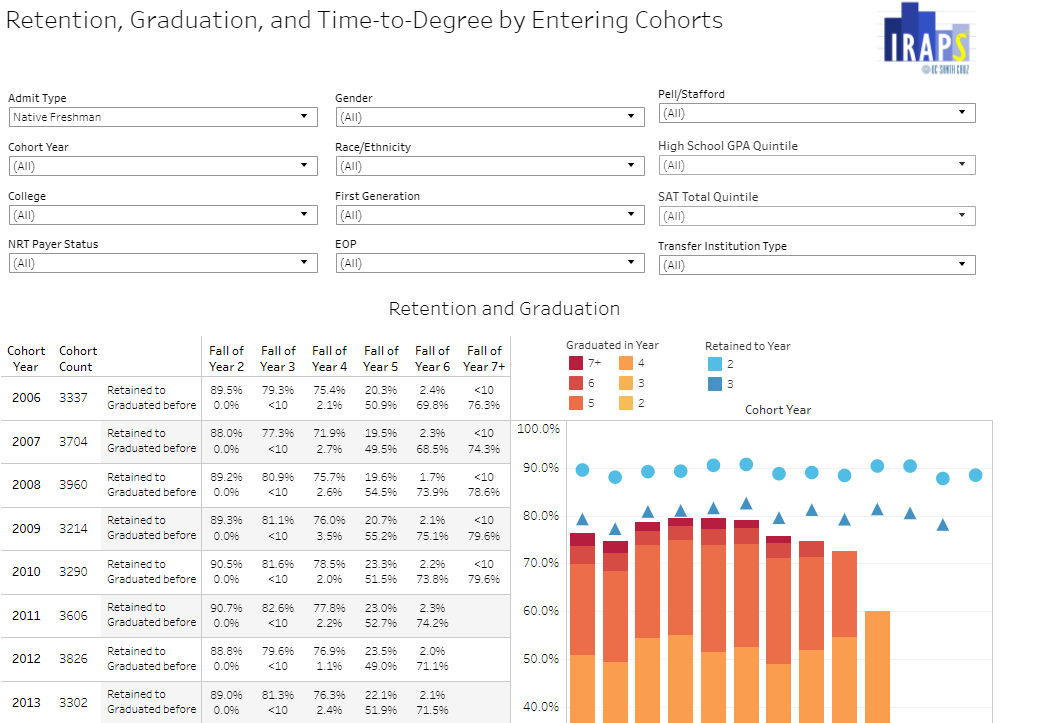
Retention, Graduation, and Time-to-Degree by Entering Cohorts
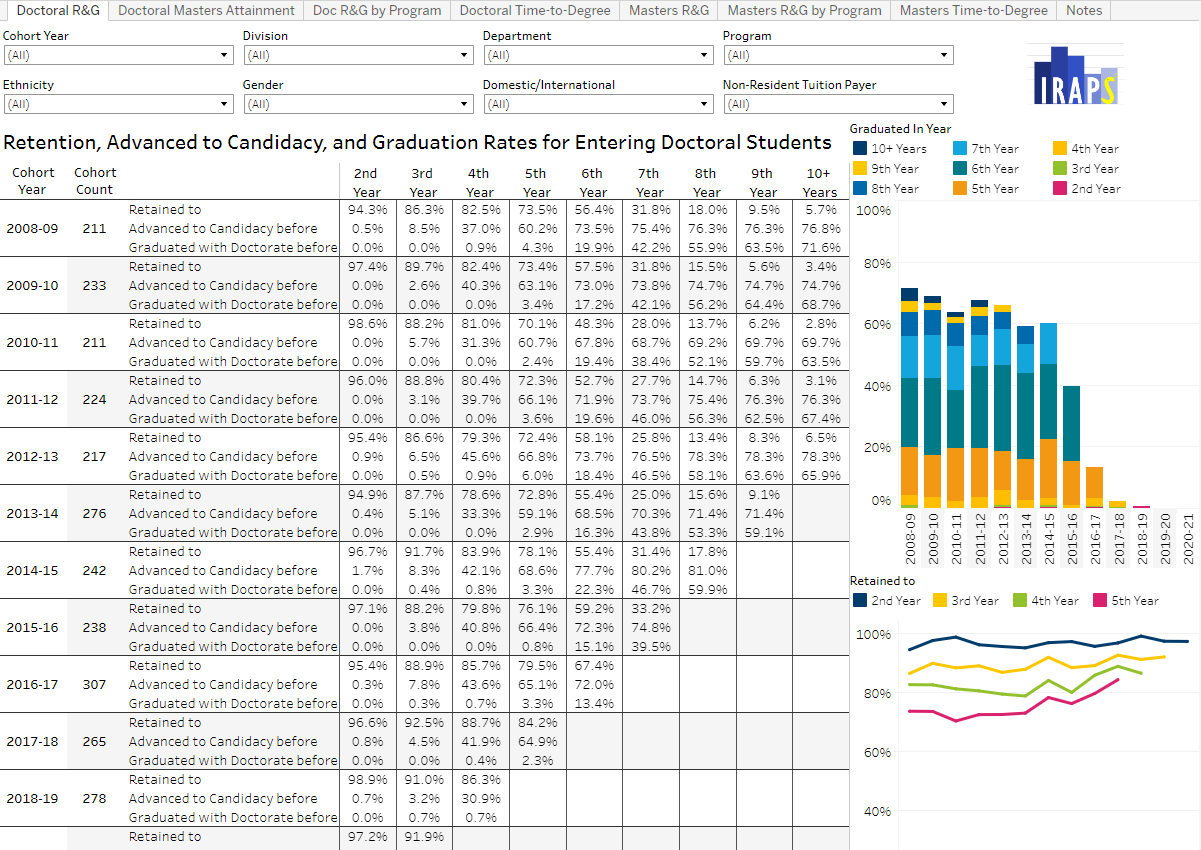 Graduate Retention, Graduation, and Time-to-Degree
Retention, graduation rates, and time-to-degree of doctoral and masters students by program, department, division and overall. Can be filtered by gender, ethnicity, domestic/international, and nonresident tuition payer status.
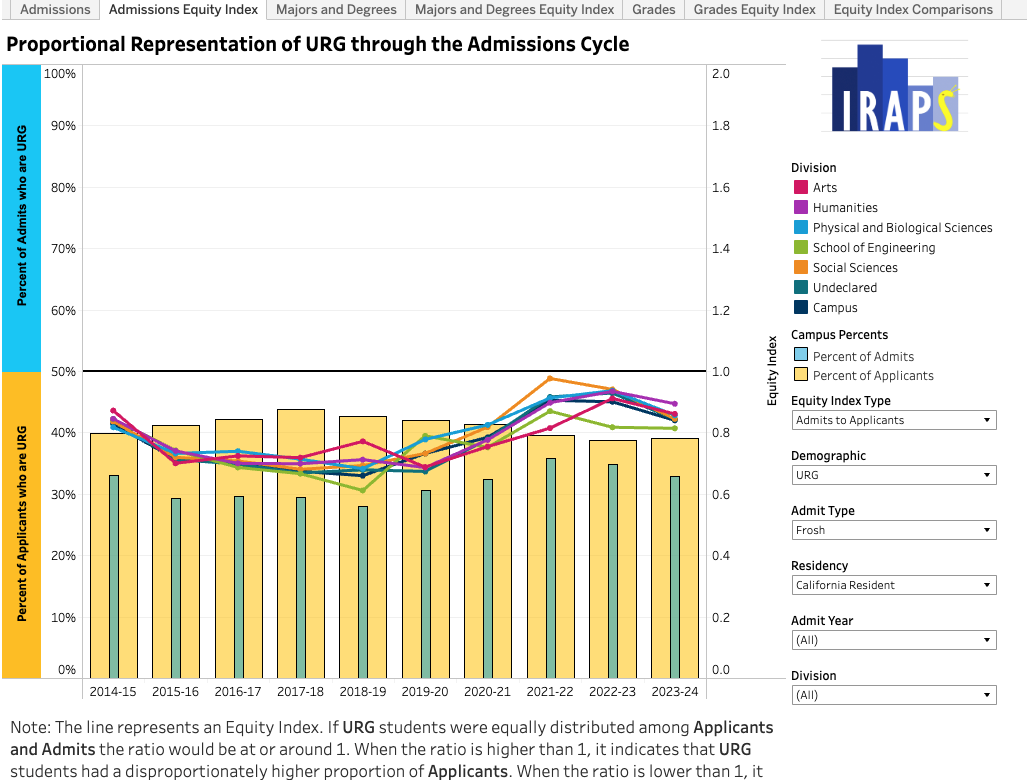
Divisional Proportional Metrics
The Divisional Proportional Metrics Dashboard provides a comparative proportional representation of underrepresented groups, women, first generation, and Pell grant recipients by division and at the campus level. The dashboard views students throughout their time at UC Santa Cruz, including admissions, majors, degrees, and course outcomes.
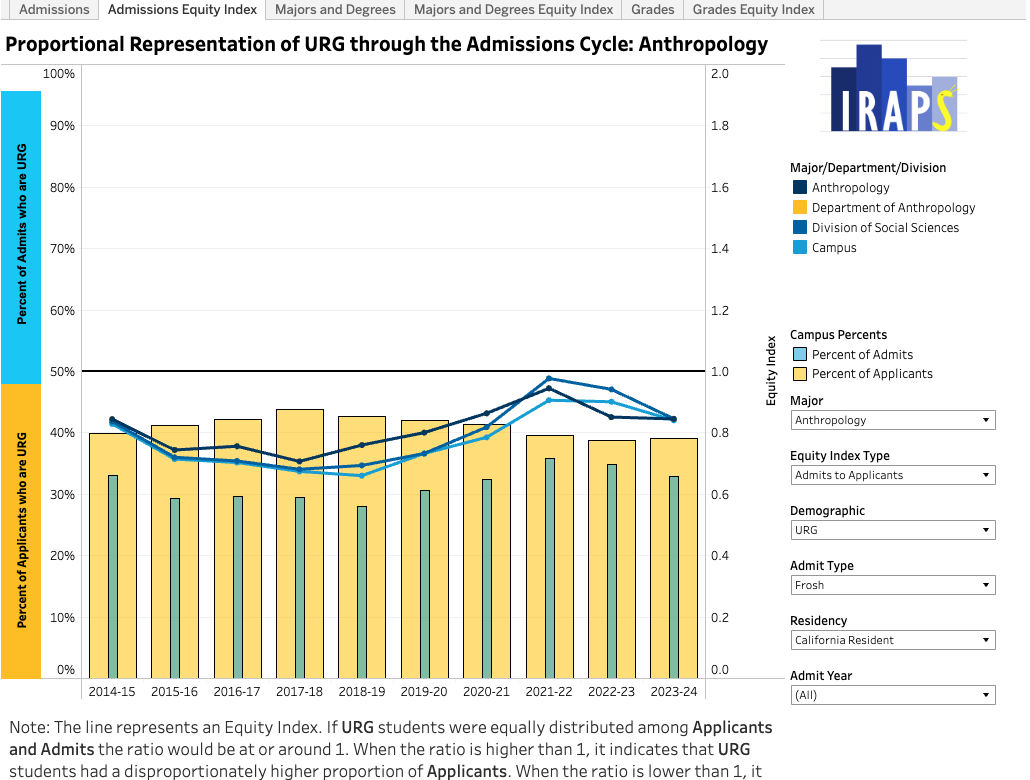
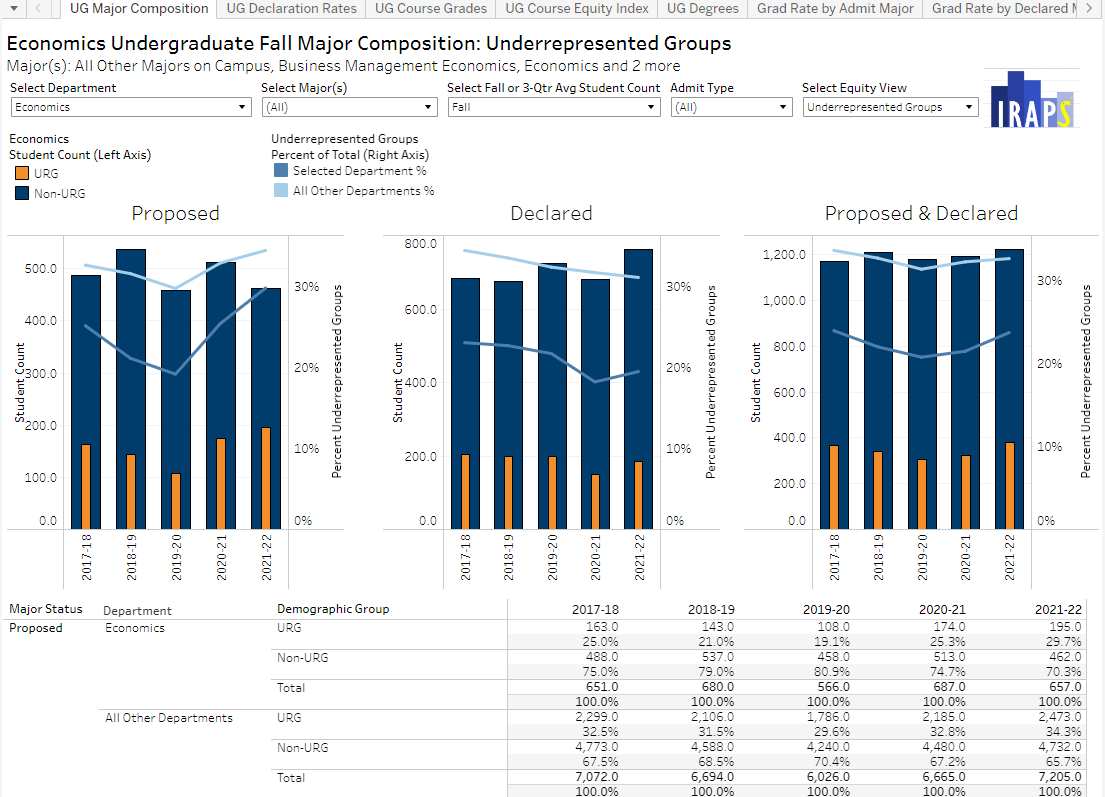
Departmental Proportional Metrics
The Departmental Proportional Metrics Dashboard provides a comparative proportional representation of underrepresented groups, women, first generation, and Pell grant recipients at the major, department, division, and campus level. The dashboard views students throughout their time at UC Santa Cruz, including admissions, majors, degrees, and course outcomes.
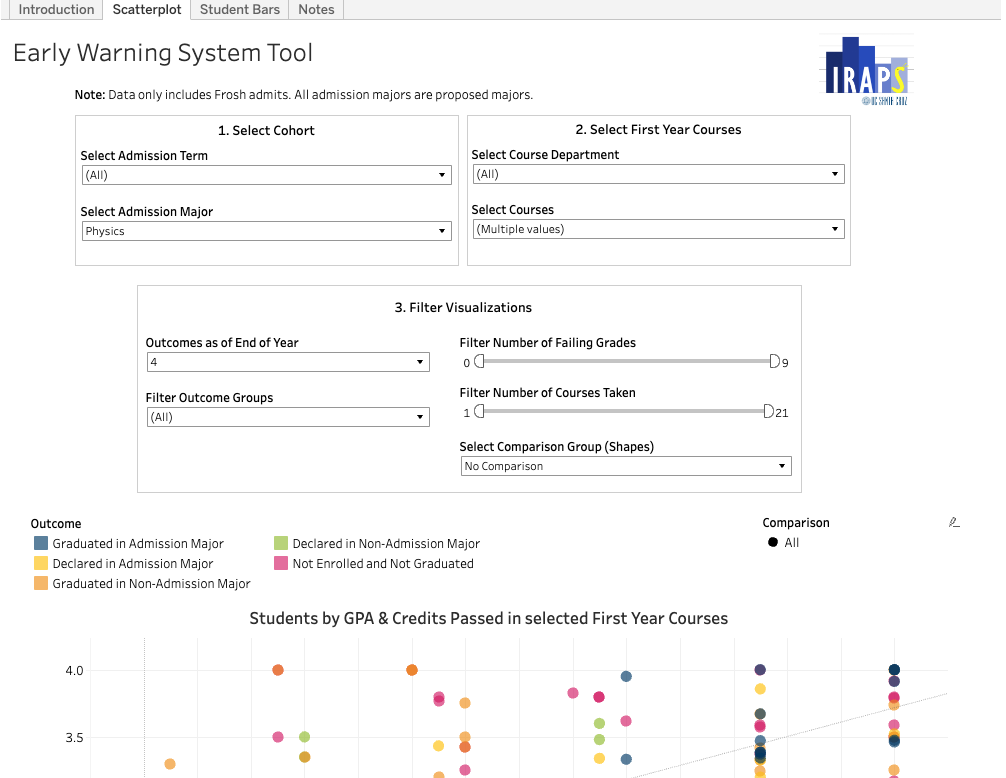
The Early Warning System Dashboard looks at courses taken in a student’s first year and how the number of units earned and GPA in the selected courses impacts their outcomes as of the end of each year since entry. Includes Frosh admits by admission major and allows comparisons between various student demographics and characteristics.
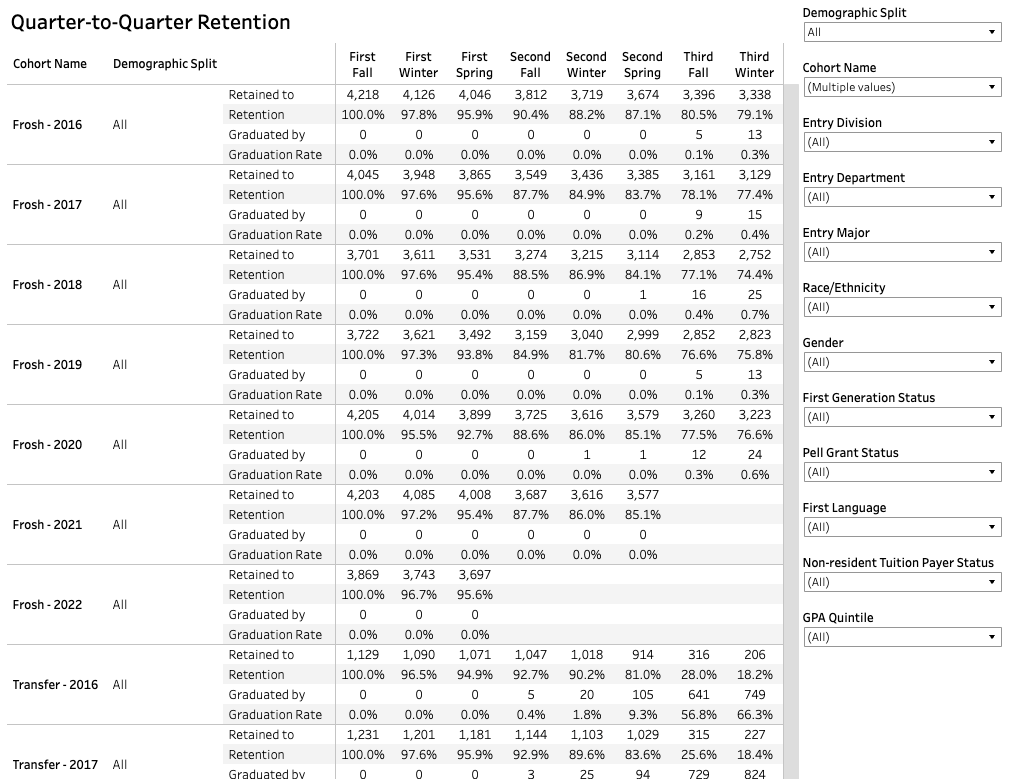
Quarter-to-Quarter Retention and Graduation Rate
The Quarter-to-Quarter Retention and Graduation Rate Dashboard shows Frosh and Transfer student retention and graduation rates by quarters since entry. Includes retention and graduation rates by admission major, race/ethnicity, first generation status, and other student demographics and characteristics.
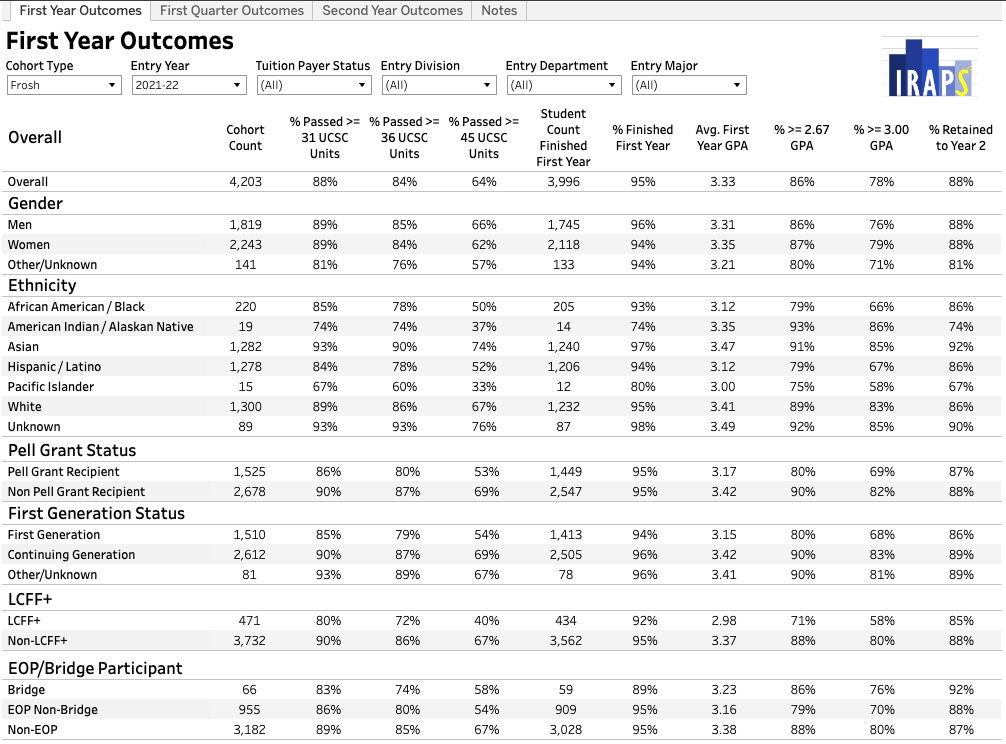
First Year, First Quarter, and Second Year Outcomes
The First Year, First Quarter, and Second Year Dashboard provides information on units completed, GPA, and retention by cohort. The dashboard includes information separated by gender, race/ethnicity, Pell grant status, first generation status, and residency. Dashboard is filterable by entry division, department, or major.
